
Fix n8n "Task execution timed out after 300 seconds" Code node freeze
Attaching memory to your LLM deadlocks the task runner on AI Agent sub-node types. Feed Code nodes through the main data path and the freeze clears.
TL;DR: n8n Code nodes hit "Task execution timed out after 300 seconds" once LLM memory is attached because the AI Agent's sub-nodes deadlock the task runner; the fix is $input-only Code nodes plus Set-node expressions.
The freeze shows up in workflows that ran flawlessly without memory: attach a memory component to the LLM and Code nodes across the whole canvas hang, then die with the watchdog error, including Code nodes positioned before the LLM node. The error text recommends raising a timeout, which is the wrong lever here. The real cause, confirmed in a bug-confirmed n8n community thread, is the runner's rebuild path rather than the memory data itself; the edits below clear it, and sibling n8n failures are collected in the Automation Error Index.
Why does attaching memory to an LLM freeze n8n Code nodes?
As of 2026, every n8n release since 2.0 executes Code nodes in a separate task runner process. A script that touches only its own input through $input and $json receives a slim payload and finishes fast. A script that reaches for another node with $('Node Name'), $node['Node Name'], or $items() forces the runner to request the entire serialized workflow from the main process and rebuild it, which means resolving every node type on the canvas, sub-nodes included.
Attaching memory is what puts the unresolvable node types on that canvas. In the reported workflow, the OpenAI call ran as a plain node while memory was absent; adding memory meant switching to the AI Agent, a LangChain cluster root that drags Chat Model, Memory, and tool sub-nodes onto the canvas with it. The runner hits a sub-node type it cannot resolve, the rebuild request never returns, and the Code node sits in an unbounded wait until the 300-second watchdog kills it. GitHub issue #20752 records the same hang with a postgresTool sub-node on an AI Agent, and the companion reports describe workflows freezing even when the agent never executed. The container log line "Unrecognized node type: ..." appearing at the moment of the stall is the signature.
The memory node itself is innocent. One reporter ran a 120-node workflow on n8n 2.11.3 where only some Code nodes broke, exactly the payload-building nodes that referenced other nodes, while the nodes that never left their own input kept working.
![Flow diagram: attaching memory puts AI Agent sub-nodes on the canvas, a Code node using $('Node') or $node['Node'] makes the task runner request the full serialized workflow, the unresolvable sub-node type leaves the request unanswered, and the 300-second watchdog kills the task; the fix path routes values through a Set node expression evaluated in the main process so the Code node reads only $input and runs instantly](https://automatelab.tech/content/images/2026/09/n8n-code-node-freeze-task-execution-timed-out-300-seconds-1-flow.png)
How to fix the "Task execution timed out after 300 seconds" freeze in n8n?
The fix keeps memory attached and rewires how Code nodes receive their data:
- Find the cross-node references. Open each frozen Code node and look for
$('Node Name'),$node['Node Name'], or$items(), the only syntax that pulls the runner into the full-workflow rebuild. - Move the values onto the main path. Add a Set node in front of the Code node and resolve the cross-node value as an expression there:
{{ $('Parse Extraction').first().json.score }}. Expressions in normal nodes evaluate in the main process, so they never touch the runner's rebuild path. Inside the Code node, read the value from$input. - Or delete the Code node entirely. Build the request body directly in the HTTP Request node with the same expressions, which removes the runner from the loop for that step.
Confirm the deadlock in 30 seconds. Stub one reference, rerun with memory still attached, and watch the node finish instantly:
// const cfg = $('Prepare Formatter').first().json;
const cfg = { test: true };
When a Code node returns items that downstream nodes map back to earlier items, keep pairedItem: { item: index } on the return, or downstream expressions reintroduce the cross-node lookups you just removed.
What if your Code node never references another node?
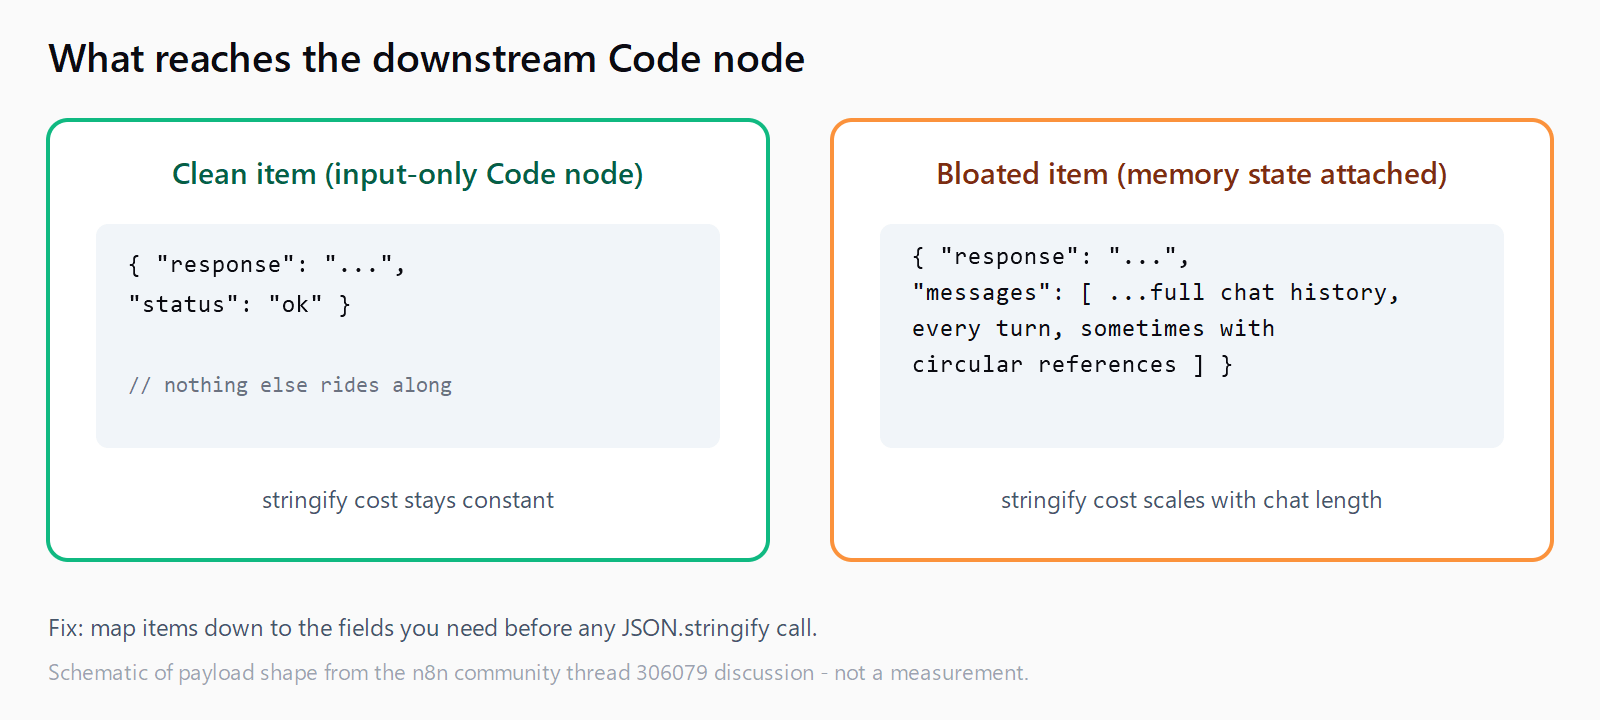
A smaller group of 300-second kills is genuine slowness rather than deadlock, and there the community thread's first-pass theory applies: with memory attached, the conversation history can ride along in the items that reach downstream Code nodes. A script that cleans, validates, or stringifies that payload now processes hundreds of historical messages, and the cost of JSON.stringify scales with chat length. Memory state can also carry circular references, which hang serialization outright.
The defensive pattern is item hygiene, the same discipline as the structured-output pattern for Code node errors: return only the fields the next node needs, before the payload reaches any stringify call.
const clean = $input.all().map(function (item) {
  return {
    response: item.json.message?.content || item.json.text,
  };
});
const payload = JSON.stringify(clean);
Never stringify $input.all() raw when LLM output is in the stream; extract the primitive fields first.
How to verify the freeze is gone?
Rerun the full workflow with memory still attached and watch two signals. The previously frozen nodes should complete in seconds, and the container log should stay free of the deadlock signature:
docker logs -f n8n | grep -i "unrecognized node type"Silence there plus a clean run means the runner never had to rebuild the workflow. Migrate frozen nodes one at a time; the changes are independent, so a single missed reference only freezes that one node.
What if the Code node still times out after the fix?
Three fallbacks, in order of usefulness. A genuine infinite loop trips the same watchdog, so audit while conditions first. The same watchdog message also came from something as small as .item used outside Run Once for All Items mode, so check the editor's lint panel before assuming the worst. If a task legitimately needs more than five minutes, the documented N8N_RUNNERS_TASK_TIMEOUT variable raises the ceiling, but treat that as masking a data problem, not as the fix.
How to clear the freeze in five minutes?
- Grep every frozen Code node for node references like
$('Fixer')or$node['Fixer']. - Stub one reference and rerun with memory attached to confirm the deadlock.
- Feed each value through a Set node expression instead of the cross-node lookup.
- Strip conversation history from items before Code nodes that stringify payloads.
- Confirm "Unrecognized node type" has vanished from the container log.
FAQ
Can I just raise N8N_RUNNERS_TASK_TIMEOUT above 300 seconds?
The variable exists and 300 is its documented default, but in the memory deadlock the wait is unbounded, so a higher ceiling only delays the kill. Raise it for genuinely heavy tasks; fix the data path for the freeze.
Why does the workflow run in the editor but time out in production?
The n8n community thread documents exactly that split: manual executions succeed while production executions hit the watchdog. Production runs always pass through the runner infrastructure where the watchdog lives, and editor paths can differ by version and deployment mode.
Does disabling task runners fix it?
No. N8N_RUNNERS_ENABLED is deprecated as of n8n 2.0 and every Code node execution runs on a runner, so the only durable workaround is data-path hygiene.
What is the "Task request timed out after 60 seconds" error?
A different limit. N8N_RUNNERS_TASK_REQUEST_TIMEOUT governs how long a task request waits for a runner to become available at all, and it surfaces on n8n Cloud when no runner picks up the work. It is not the 300-second execution watchdog.
Is this the same bug as memory not saving tool calls?
No. The tool-calls bug loses agent history across turns, while this one freezes Code nodes at runtime. Both are AI Agent memory quirks, but with different fixes.